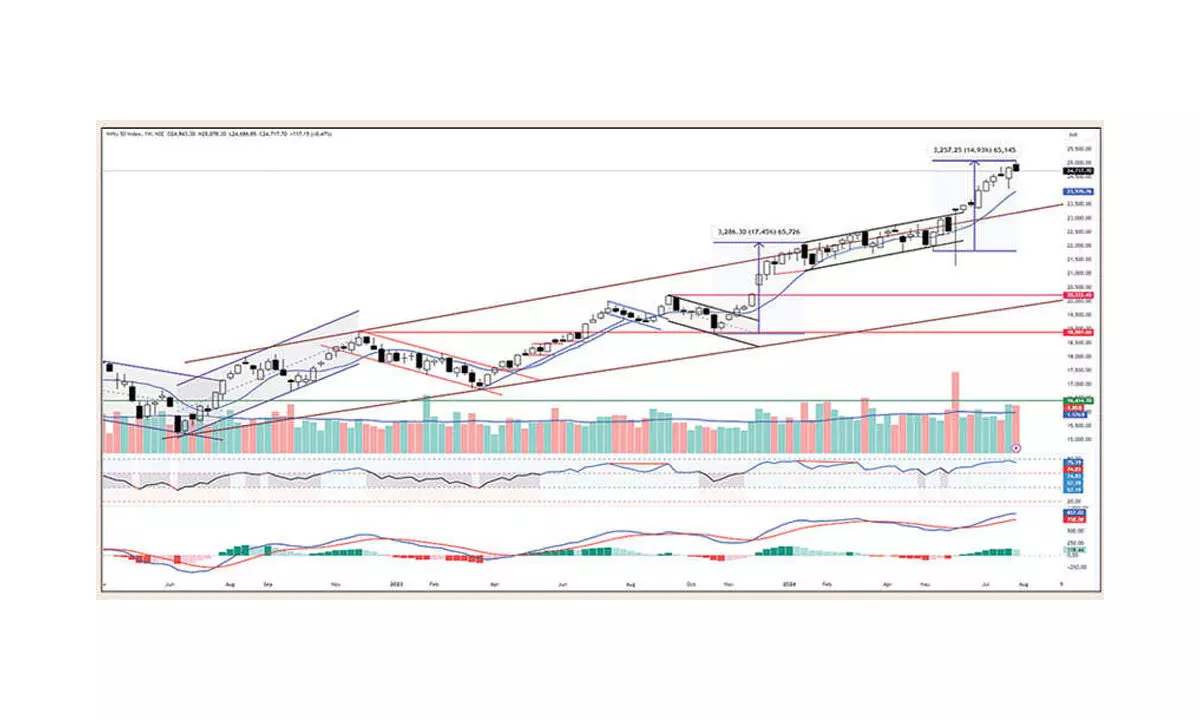
Charts indicate overextension

MACD line forms bearish divergence; Daily RSI formed a bearish divergence; Out of 8 weeks of the rally, in 6 weeks, the Nifty closed above the upper band
The benchmark index NSE Nifty snapped an eight-week winning streak as Nifty declined by 117.15 points or 0.47 per cent for the last week. BSE Sensex also declined by 0.43 per cent. The Nifty Midcap index is up by 0.25 per cent, and the Smallcap index is down by 0.28 per cent. The Nifty Energy index is the top gainer with 2.53 per cent, and Pharma is up by 1.39 per cent. The Realty index is down by 3.76 per cent, and the IT index declined by 3.04 per cent. The market breadth is mostly positive. The India VIX is up by 16.92 per cent to 14.32.
The FIIs bought Rs5,407.83 crore and the DIIs bought Rs23,486.02 Crore in July month. The Nifty finally ended its unabated eight-week rally influenced by the global market. On Friday, the index fell by 1.17 per cent, with a big gap-down opening. As we warned, the index closed below the 8EMA support and proved that the No impulse will continue forever and has to enter into a counter-trend. Interestingly, the swing was 8 weeks old, which is a Fibonacci number. The Nifty closed at the week’s low, which gave a weaker signal. But it is still much above the 10-week average. It is trading 3.68 per cent above the 50DMA and 0.53 per cent above the 20DMA, which is at 24,588 points. The rising channel’s support is also at a similar level. Before the big decline, the index had formed new highs with indecisive candles and the daily ranges were shrunk.
As stated earlier, the index showed an overstretched condition and was vulnerable to mean reversion. If the price moves too far from the mean, it must come to the mean level. Currently, the index is trading 6.61 per cent above the 20-week average, and the Bollinger bands are expanding. Out of eight weeks of the rally, in six weeks, the index closed above the upper band, which is an indication of overextension. Currently, the index is 1,531 points above the 20-week average. The impulsive move is because the index oscillated around the 20-week average for 18 weeks. Any prolonged congestion will lead to a sharp move. Before the 19 weeks of range-bound activity, the index had experienced an upside-sharp move for 9 weeks. In fact, the index has met the 100 per cent Fibonacci extension target of the prior swing.
(The author is Chief Mentor, Indus School of Technical Analysis, Financial Journalist, Technical Analyst, Trainer and Family Fund Manager)


