Live
- Partymen, aam aadmi air grievances before Dy CM
- NTPC Green to set up projects worth 1.87 lakh cr in AP
- CS holds review meet on ‘Indira Mahila Shakti’ scheme
- KTR to participate in Deeksha Diwas on Nov 29
- First Telugu bureaucrat to become CAG of India
- Plea in HC to extend voting rights to teachers in Council polls; notices issued to govt
- Political heat rises over Adani indictment in AP
- Excise police arrest five, seize 1.1 kg ganja
- GRP nabs one, recovers gold ornaments worth Rs 21 lakh
- Design conclave held at T-Hub
Just In
Correction more likely as Nifty reaching overbought zone


In a truncated last week of the 2023-24 financial year, NSE Nifty missed a new all-time high by just 10 points.
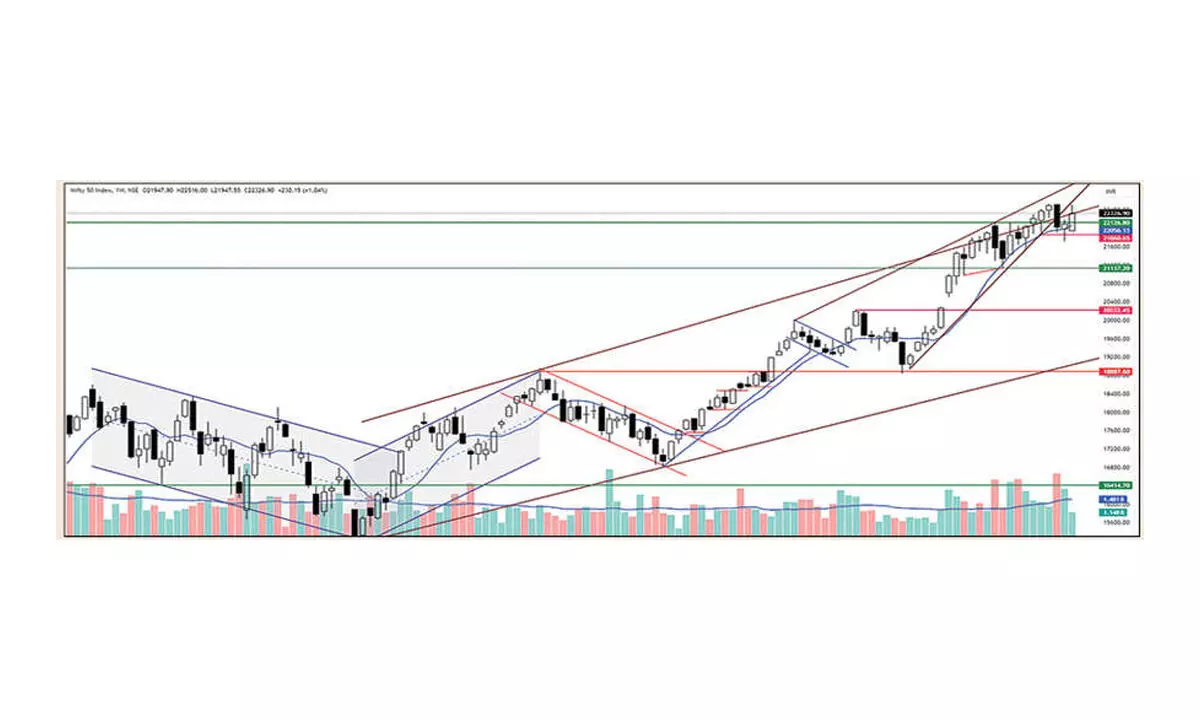
In a truncated last week of the 2023-24 financial year, NSE Nifty missed a new all-time high by just 10 points. The benchmark index gained 230.15 points, or 1.04 per cent. BSE Sensex is up 1.13 per cent. The Nifty Midcap-100 and Smallcap-100 advanced by 1.62 per cent and 1.42 per cent, respectively. The Nifty Auto and Energy indices were the top sectoral gainers with 1.77 per cent and 1.59 per cent, respectively. On the flip side, Nifty Media is down by 2.92 per cent, and IT declined by 0.82 per cent. The India VIX is up by 4.94 per cent to 12.83. The FIIs bought Rs3,314.47 crore, and the DIIs bought Rs56,311.60 crore during the last month.
During the last day of the Financial Year, equities rebounded dramatically and closed just 0.87 per cent below the all-time high. Before that, the Nifty rallied by 392 points and missed another new lifetime high by just 10 points. The morning session’s massive rally and sudden sharp sell-off by 189.10 points surprised everyone and triggered the stop losses on both sides. Despite the market making new highs, the concerns have remained for the last three months. The price structure since the 23rd January lows lost its rhythm. There were more down-side candles than advancing candles, and the declining days attracted more volumes, which is a distribution characteristic. Last week, it registered the lowest volume after November. Most importantly, the declining and advancing days do not exceed two to three days. After closing below the previous week’s low and forming a bearish engulfing candle, the bears failed to pull the market below the 10-week average. For the last ten weeks, the Nifty is taking support on the moving average and bouncing. Though the index is making a higher high, the RSI has yet to form a high and developed a negative divergence. The weekly MACD has given the bearish signal, and the histogram shows an increased bearish momentum. When the index makes higher highs, momentum indicators decline, which is a clear case of exhaustion.
The index formed its second consecutive Evening Star candle on a monthly chart. It closed above the previous month’s high. Interestingly, the last two months’ price ranges are 767 points and 816 points, which is why the price structure looks the same. Before these two candles, A Doji candle failed to confirm bearish implications. Importantly, after a breakout of four months of consolidation, between August and November 2023, the index rallied by 11.75 per cent or 2368 points.
Now, the question is that the 22,526.60 is an intermediate top? Since there were no major corrections from March 2023 low, experts, who believe in the time cycle, expect a significant correction. From the June 2022 low, followed by over 18 per cent correction, the recent lifetime high was formed after 21 months, which is the Fibonacci number.
(The author is Chief Mentor, Indus School of Technical Analysis, Financial Journalist, Technical Analyst, Trainerand Family Fund Manager)

© 2024 Hyderabad Media House Limited/The Hans India. All rights reserved. Powered by hocalwire.com


