Live
- Gold rates in Vijayawada today surges, check the rates on 22 November, 2024
- Gold rates in Visakhapatnam today surges, check the rates on 22 November, 2024
- Satya Kumar flays YSRCP govt for ruining new med colleges
- AP High Court to hear RGVs anticipatory bail plea in social media remarks case
- ICC Champions Trophy: PCB appoints Chief Operating Officer; reiterates stand to host Champions Trophy entirely in Pakistan
- Probe initiated after food poisoning incident
- BGT 2024-25: Nitish Kumar Reddy, Harshit Rana make India Test debuts in first Border-Gavaskar Trophy in Perth
- 100 students fall sick after consuming contaminated food
- TCS will commence ops in Visakha in 3 months: Lokesh
- Pawan, 2 other ministers rule out VSP privatisation
Just In
It's wise to exit long positions on any bounce


It’s wise to exit long positions on any bounce
After a major fall on last Thursday, the green screen was back on Friday. The short-covering in several stocks lifted the indices. All sectoral indices closed in green on Friday.
After a major fall on last Thursday, the green screen was back on Friday. The short-covering in several stocks lifted the indices. All sectoral indices closed in green on Friday. But, on a weekly basis, the NSE Nifty fell by 454.7 points or 3.95 per cent during the last week. The BSE Sensex fell by 3.8 per cent. The broader indices Nifty Midcap-100 and Smallcap-100 fell by 5.2 per cent and 5.6 per cent respectively.
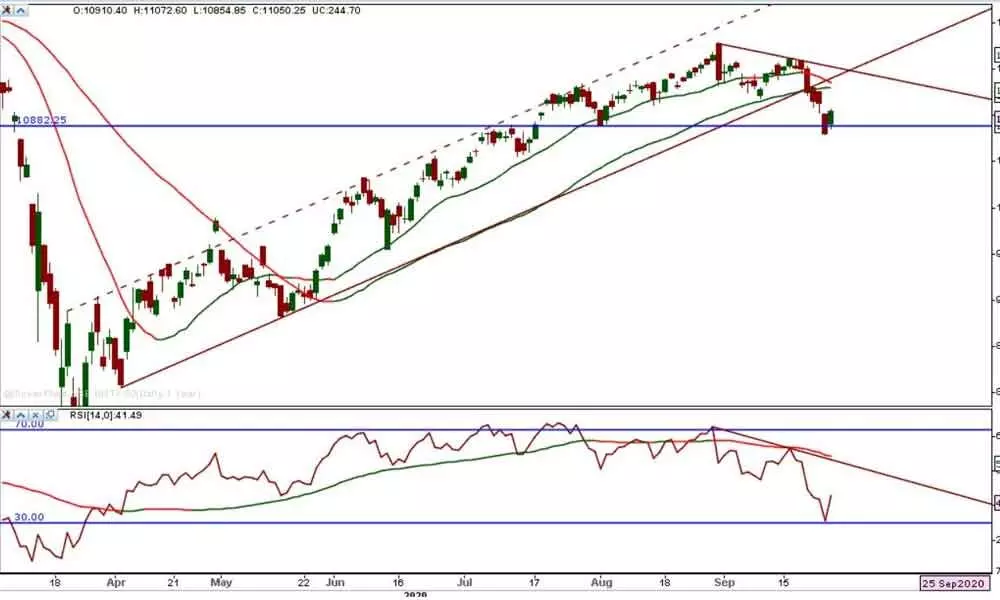
Technically, the Nifty entered into a confirmed downtrend. As it closed below the prior swing lows and 50DMA decisively after May 27 with seven distribution day count, the trend is clearly reversed to downward. There is a long channel breakdown too. The Nifty lost over 1,000 points or 8.5 per cent. This is the second thousand point correction during the rally since March lows. As the Nifty broke the upward channel, the breakdown target is also just over 1,000 points. The current breakdown happened at 11,290 levels along with 50DMA breakdown. Any steep correction will result in counter-trend rallies. Friday's rally comes into that category. We need to watch where this rally will end.
Since March lows, the size of the bullish bars is smaller and with a gap up openings. But look at the bearish bars, they are larger than the bearish bars. And on the most bullish days, the Nifty traded within the first 15 or 30 minutes range. As we mentioned earlier, there are several similarities between Oct-Jan structure to July-Sept structure. There clear evidence showing the distribution is happening at higher levels. This distribution pattern is visible in divergences. Lack of momentum is also a concern for the last 2-3 months.
On the downside, there are several supports placed at 10,600-650 zone. After this, 38.2 per cent retracement support placed at 10,158, which is also another swing low on June 25. We can't forecast more than this level. We need to watch the market behaviour between 10,600-11,600 zone.
On the price internals (indicators) front, the RSI (41.49) bounced back to above levels after taking support at 30 levels. Let us watch for, will the current up move above 60 zone for bullish strength. Even a move above 50-55 zone is also good for the short term. It may reach to 55 during the counter-trend consolidation. The MACD line is below the zero-line on a daily chart is a bearish sign, and the histogram on a weekly chart clearly suggests that bullish momentum is waning. The Directional movement index ADX is turned up above 20 levels, indicating that, bears are gaining strength. The negative Directional Movement Indicator (DMI) is much above the +DMI is a weaker sign. The Nifty almost took support at long term average 200-DMA (Now at 10757) on Thursday. The Anchored VWAP support is at 10,277 and resistance at 11,346. DEMA (20) resistance is at 11,201.
With the above technical evidence, it wise to exit the long positions on any bounce towards 50DMA. Very few stocks in Nifty-50 showing strong technical strength after Thursday's fall. The topping formations in large-caps and the clean breakdowns in leading banking stocks is a major worry now for market direction. IT sector looks better on the chart at the current juncture. Index stocks like Coal India, IOC and Bharti Airtel are near or at the March lows. Mid-cap and Small-cap indices are reacting from the resistance levels.
(The author is a financial
journalist and technical analyst. He can be reached at [email protected])

© 2024 Hyderabad Media House Limited/The Hans India. All rights reserved. Powered by hocalwire.com


