Live
- Australia prepares for catastrophic bushfire over Christmas period
- Global prevalence of atopic dermatitis to reach 42.42 mn by 2033: Report
- OpenAI's GPT 5 Faces Delays Amid Data and Financial Challenges
- Sunny Leone's Name Used in Fraud Under Chhattisgarh’s Mahtari Vandan Yojana
- Gold Business Fraud Uncovered in Atmakur, Wanaparthy
- Rachakonda Police Seize Rs.88 Crore Worth Drugs, Arrest 521 Accused
- Sriram Krishnan Appointed Senior Policy Advisor for AI at the White House
- Cyclone alert at seven ports in Tamil Nadu; rain, strong winds expected
- Uttarakhand CM to attend MP govt's 'Jan Kalyan Parv' in Sagar today
- Sri Jagdamba Pearls Expands Presence with the launch of its Second Store in Bengaluru at Lulu Mall
Just In

The global pandemic conditions and selling pressure from big investors dampened the market sentiments across the globe. All the benchmark indices...
The global pandemic conditions and selling pressure from big investors dampened the market sentiments across the globe. All the benchmark indices incurred big losses. The Nifty lost 576.45 points or 6.57 per cent in last four trading sessions while benchmark BSE Sensex shed 7.5 per cent. Broader indices Nifty Midcap-100 and Smallcap-100 fared a bit better than the benchmarks with 3.8 and 2.3 losses respectively. Nifty Pharma index gained 8.1 per cent while FMCG index rose by 3.1 per cent. All other sectoral indices closed with huge losses. Nifty Private Bank index lost 14.7 per cent and Nifty Bank closed with 13.6 per cent decline. FIIs sold shares worth Rs 65,816.70 crore in March, the highest ever selling in a single month.
After a gap down opening on Monday, Nifty moved in a range for next two days. As we expected earlier, the Nifty is trading in a consolidation zone for the second week in a row. But, as Nifty retraced more than 61.8 per cent of the prior week's upward move, hopes of a counter-trend rally have vanished. Even though the market is drifting down, the daily range is coming down from 800-500 points (at the beginning of the fall) to 250-350 points now. This reflected in the contraction of Bollinger Bands. The question now is whether the market can protect its prior low of 7551. There are two scenarios we can expect. First, it may go near to 7,551 and bounce back. In this scenario, there is a probability of forming a double bottom in next 10 trading sessions at least. In this scenario, traders will show interest in buying only after Nifty reverses to above 9,038, a double bottom valley or a confirmation point. Thereafter, the index will test 9970-10447 levels. From there, the index will go into a nightmarish tailspin. There are valid reasons for this. The Nifty trading range has completely gone out of Bollinger Bands for the last four weeks. The index has to come into the bands at one point or the other. And the RSI is in an oversold condition on a weekly chart.
In the second scenario, Nifty may breach recent bottom of 7,551 and test 6,825 (2016 bottom). Then, the markets may remain at that level for some time, before consolidating. Thereafter, it will bounce back to 9,600 level.
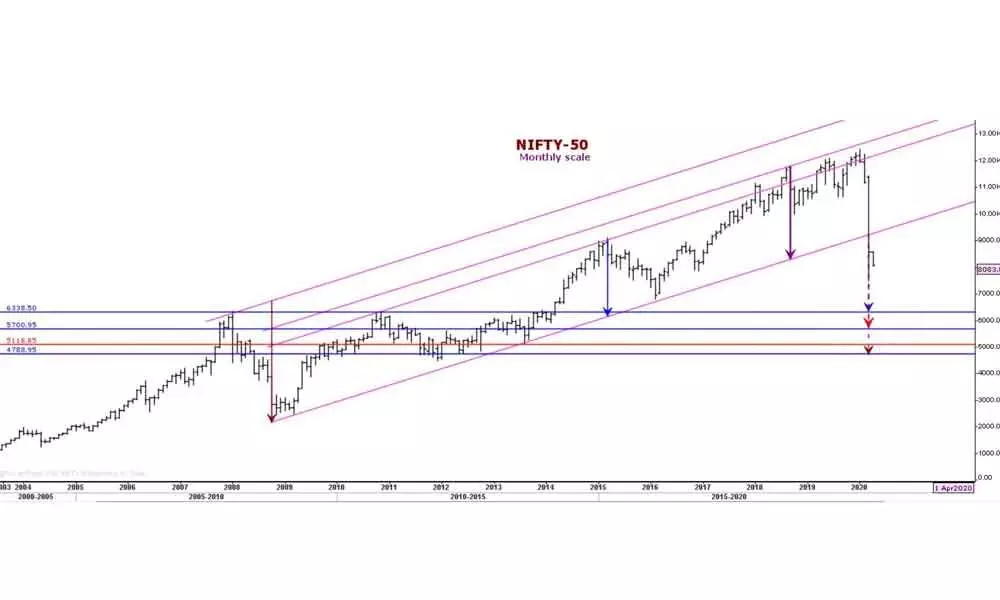
The above two scenarios are only for the short term. Long-term charts are showing a completely different picture. For, the first time since its inception, the BSE Sensex has broken down the upward channel on a quarterly chart. The most worrying fact is that cash volumes are more than the 2008 bear market. The March month recorded highest volume in the history of Nifty. As the channel has broken down decisively with a massive volume spurt, the measured channel target with multiple breadths are placed at 6338, 5700 and 5100-4788. These levels look scary like a horror movie. But, as we are witnessing the worst sell-off in history, we can't be sure of any support level saving the index. Nifty hit new peak of 11, 751 in September 2018 before scaling to another lifetime high of 12,103 in June 2019. Subsequently, it reached all time high at 12,430 in January 2020. A close look at corrections from 2019 top and 2020 top reveals that Nifty has reached peaks on low volumes while registering high volumes during corrections. Going by this, it can safely be explained that the entire 2019 rally was a bull trap. We could see lack of confidence in the bar sizes. The down bars being bigger with more volumes itself is the first sign of suspicion or a sign of distribution in the rally. I mentioned this scenario in many of my 2019 columns.
Now, all the major economies are witnessing recessionary conditions and entering into a negative growth rate era. When the world is under a lockdown, every business activity comes to a standstill. Unemployment is at a record level. The global economy is just reminding us of 1930s and WW-2 conditions. So, future is uncertain and it is unwise to be optimistic about the equity markets as of now. As I cited in previous columns, it's better if investors wait until economic fundamentals improve and a sound technical base is formed.
(The author is a financial journalist and technical analyst. He can be reached at [email protected])

© 2024 Hyderabad Media House Limited/The Hans India. All rights reserved. Powered by hocalwire.com


