Nifty forms bearish engulfing pattern

Nifty forms bearish engulfing pattern
The domestic equity markets fell sharply with an intense profit booking
The domestic equity markets fell sharply with an intense profit booking. The selling pressure was seen in the broader market and across the sectors. The NSE Nifty has declined by 338 points or 1.87 per cent and settled at 17764.80. The BSE Sensex is also down by 1.7 per cent. The broader indices Nifty Midcap-100 and Smallcap-100 indices declined by 2.1 per cent and 1.3 per cent, respectively. On the sectoral front, the Nifty Metal index, down by 5.3 per cent, was the top loser. PSU Bank and Realty indices declined by 3.4 per cent and 3.3 per cent. The only Nifty Auto index is able to close with a tiny gain of 0.4 per cent. The FII sold Rs 3930.62 crore on Thursday. Overall, they sold Rs 9999.51 crore worth of shares in the current month. The DIIs bought Rs 9663.87 crores. The Market breadth is negative for the entire week.
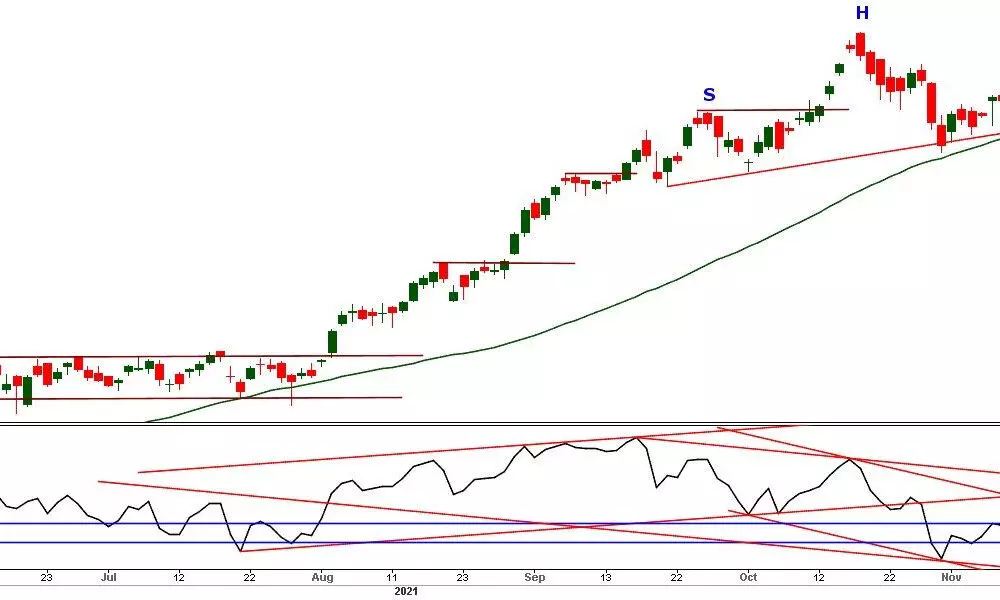
Our cautious view of the benchmark index proved right. The end of counter-trend consolidation triggered multiple breakdowns in the Nifty. On a daily chart, it broke the bearish flag and head and shoulders on the top. These two pattern breakdowns have very serious bearish implications. The bearish Flag pattern target is placed at 17218, which is equivalent to the flag pole.
The head and shoulders pattern target is placed at near 16700 levels. The interesting point in fall is that the Nifty has closed below the 23.6 per cent retracement of the prior rally from the 28th July low for the second time. The 38.2 per cent retracement level (17423) and the prior swing low (17452) are at a similar level. Before meeting the bearish pattern breakdowns, the Nifty may take support at the support zone and may bounce to make another lower high. The interesting point here is that the Nifty also formed a symmetrical triangle. The Nifty closed at support, and a close below the previous day low 17688 will result in another bearish breakdown.
Even though there are several bearish pattern breakdowns in the Nifty, it yet forms an intermediate or a major low. The index is still moving in a long rising channel. Only a close below the prior swing, 17452, will be serious bearish implications. In fact, the Nifty has not corrected more than 8.3 per cent since March 2020 low. It corrected 8.29 per cent during February-April this year. Most of the corrections were limited to around five per cent. Even the current corrective move is just 5.3 per cent. In any case, the Nifty tests the 61.8 per cent retracement level or 10 per cent correction level (16693), the market enters into a long-term bearish trend. The long rising channel, drawn from the March 2020 low, support is placed at the 50 per cent retracement level at 17057.
The market suddenly turned bearish not only because of the above pattern breakdowns. The benchmark index currently held five distribution days in the last 25 days and breached the 50DMA decisively. This is nothing, but an uptrend under pressure. As mentioned above, a close below the prior swing will be a change in the trend direction. The other significant pattern is that it formed a bearish engulfing pattern on a weekly chart. The last three week's price action is limited to, October last week's price range. In another way, it failed to move above the 18342, a minor high. Another minor high is at 18210. These levels act as a strong resistance. Only a close above at least 18210 will negate the bearish implications.
For the next week, the immediate support is placed at the 17613, which is 29th October low. A close below this will negate the inside bar rule, and it is a downside breakout. This breakout target is also placed at 17452. So, any bounce will give an opportunity to sell as long as it sustains below the prior day high of 17946.
(The author is a financial journalist and technical analyst)


