PL Sector Update - Agro Chemicals & Fertilizers - Crop acreages flat YoY; Cumulative rainfall as on 06th Sep’23 down 11% YoY
Agro Chemicals & Fertilizers – Swarnendu Bhushan – Co Head of Research, Prabhudas Lilladher Pvt Ltd
Agro Chemicals & Fertilizers – Swarnendu Bhushan – Co Head of Research, Prabhudas Lilladher Pvt Ltd
Weekly Update – Crop acreages flat YoY; Cumulative rainfall as on 06th Sep’23 down 11% YoY
§ Crop Acreages as on 08th Sep’23: flat YoY
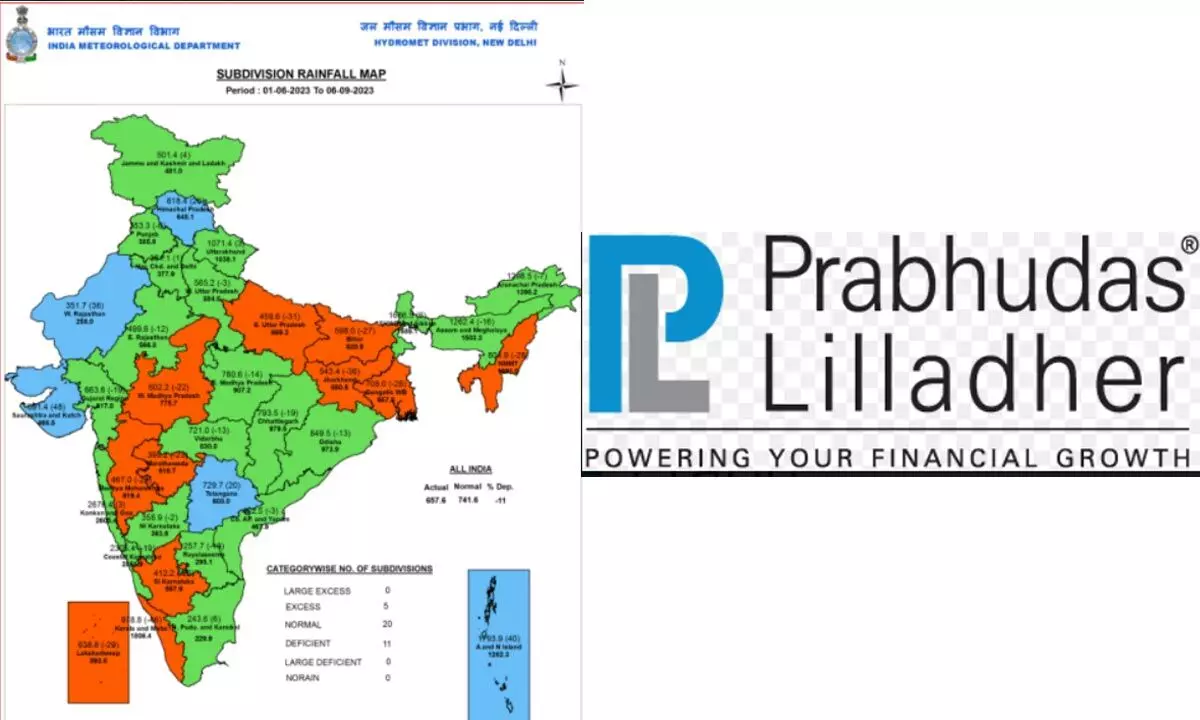
§ Rainfall as on 06th Sep’23 down 11% YoY
§ Water Reservoir levels as on 06th Sep’23- down 26% YoY; South India remains lower
§ Simon-Thorsten Wiebusch to take over as Managing Director & CEO of Bayer Crop Science Ltd (BCSL)
§ Sugar prices up on deficient rainfall in key cane states
§ ADAMA launches first off-patent CTPR-based offerings in India
Exhibit 1: Crop Acreages as on 08th Sep’23 flat YoY
| (Lac Ha) | Till 01st Sep | Till 08th Sep | |||||
| Crops | In 2023 | In 2023 | YoY % | In 2023 | In 2022 | YoY % | WoW% |
| Rice | 398.1 | 383.8 | 3.70% | 403.4 | 392.8 | 2.70% | 1.30% |
| Pulses | 119.1 | 130.1 | -8.50% | 119.9 | 131.2 | -8.60% | 0.70% |
| Coarse Cereals | 181.1 | 179.1 | 1.10% | 182.2 | 181.2 | 0.50% | 0.60% |
| Oilseeds | 190.1 | 191.9 | -0.90% | 191.5 | 193.3 | -0.90% | 0.70% |
| Sugarcane | 59.9 | 55.7 | 7.70% | 59.9 | 55.7 | 7.70% | 0.00% |
| Jute & Mesta | 6.6 | 7 | -5.70% | 6.6 | 7 | -5.70% | 0.00% |
| Cotton | 123 | 125.6 | -2.10% | 125 | 126.9 | -1.50% | 1.60% |
| Total | 1077.8 | 1073.2 | 0.40% | 1088.5 | 1088 | 0.00% | 1.00% |
| Incremental WoW | 24.2 | 23.3 | -4.00% | 10.7 | 14.8 | 38.40% | |
Source: Agricoop, PL
Exhibit 2: Rainfall as on 06th Sep’23 down 11% YoY
| Week ending | % Deviation from Normal | ||||
| Date | Country as a whole | Northwest India | Central India | South Peninsula | Northeast & East India |
| 31-May-23 | 22 | 337 | 13 | -24 | -45 |
| 07-Jun-23 | -57 | 69 | -71 | -63 | -84 |
| 14-Jun-23 | -53 | -20 | -73 | -54 | -48 |
| 21-Jun-23 | -33 | 37 | -60 | -58 | -18 |
| 28-Jun-23 | -16 | 42 | -17 | -45 | -21 |
| 05-Jul-23 | -7 | 37 | -6 | -32 | -17 |
| 12-Jul-23 | 2 | 59 | 4 | -23 | -19 |
| 19-Jul-23 | 2 | 46 | 8 | -19 | -19 |
| 26-Jul-23 | 5 | 34 | 14 | 2 | -25 |
| 02-Aug-23 | 4 | 26 | 13 | 2 | -24 |
| 09-Aug-23 | 0 | 18 | 7 | -7 | -19 |
| 16-Aug-23 | -6 | 10 | -3 | -12 | -19 |
| 23-Aug-23 | -7 | 8 | -4 | -15 | -19 |
| 30-Aug-23 | -9 | 4 | -10 | -17 | -16 |
| 06-Sep-23 | -11 | -2 | -12 | -11 | -19 |
Exhibit 3: Water Reservoir table as on 06th Sep’23: down 26% YoY; South India remains lower
| Reservoir levels | Current Year | Last Year | Avg. of last 10 years |
| All India | 62% | 84% | 72% |
| North India | 82% | 87% | 82% |
| East India | 45% | 62% | 65% |
| West India | 71% | 89% | 70% |
| Central India | 71% | 81% | 77% |
| South India | 48% | 91% | 69% |
Source: CWC, PL
Exhibit 4: Weekly Crop Prices continues to be remunerative YoY.
| Crops(RS/Qntl) | 4th Week Aug'23 | 1st Week Sep'23 | 2nd Week Sep'23 | 2nd Week Sep'22 | YoY(%) | WoW (%) | Avg. Aug'23 | Change (%) |
| Wheat | 2,548 | 2,567 | 2,464 | 2,432 | 1.30% | -4.00% | 3,353 | -26.50% |
| Jowar(Sorghum) | 3,361 | 3,373 | 3,500 | 2,426 | 44.30% | 3.80% | 3,395 | 3.10% |
| Bajra(Pearl Millet) | 2,156 | 2,174 | 2,096 | 2,103 | -0.30% | -3.60% | 2,200 | -4.70% |
| Arhar Dal (Tur) | 16,511 | 11,744 | 13,839 | 9,535 | 45.10% | 17.80% | 22,528 | -38.60% |
| Maize |


