Live
- Rachakonda police issues prohibitory orders in view of TGPSC tests
- SBI rescues sr citizen from `46L cyber fraud
- 12-yr-old dies of electrocution
- Installation of smart meters opposed
- State Cabinet expansion in focus as CM leaves for Delhi
- Need to reintroduce country’s forgotten pride: Bhagwat
- Pant shatters Iyer's IPL auction record, sold to Super Giants for Rs 27 cr
- Yuva Sangeetha Sammelanam held
- Dharani proves a bane for 25K families across State
- Reckless, Dangerous Arms Race
Just In
Price action indicates a pause for bulls


Price action indicates a pause for bulls
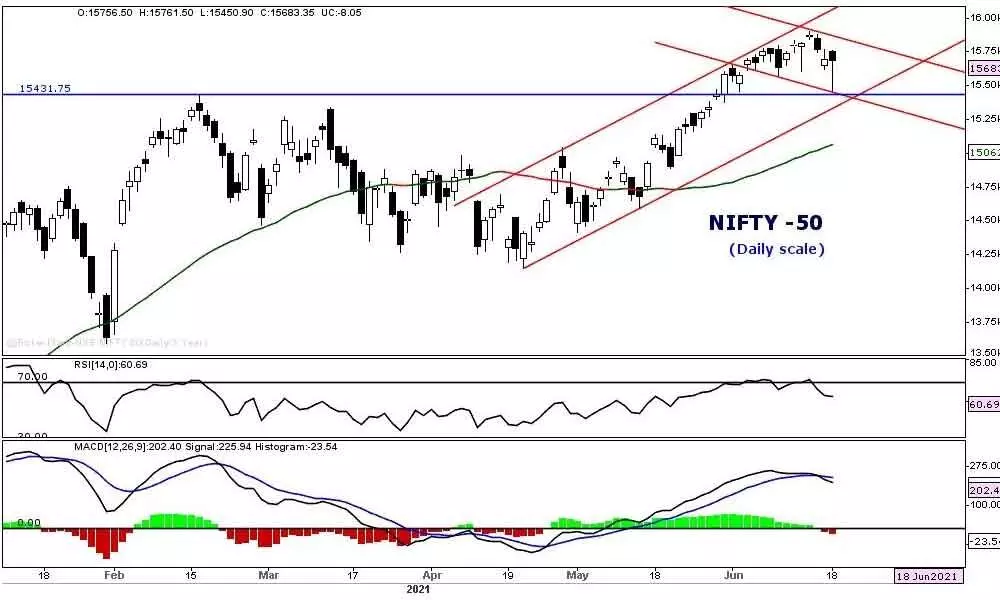
Equity benchmark indices snapped four-week winning streak amid subdued global markets. The indices witnessed volatile impulse moves during the week. The NSE Nifty closed at 15683.3 points with 116 points loss.
Equity benchmark indices snapped four-week winning streak amid subdued global markets. The indices witnessed volatile impulse moves during the week. The NSE Nifty closed at 15683.3 points with 116 points loss. The BSE Sensex lost 0.2 per cent. The FMCG index up by 1.8 per cent, and the IT index advanced by 0.8 per cent. The remaining sectoral indices closed lower for the week. The Metal index down by 6.6 per cent, the big loser. Pharma, Auto, Energy, PSU Bank and Reality indices declined by 3 to 4 per cent. FIIs turned net buyers once again. They bought Rs.5848.76 crore during the current month. DIIs sold Rs.2293.06 crores worth of equities. The advance decline ratio is mostly positive last week.
The Nifty showing classical distribution signs during the last week, after hitting a fresh lifetime high at 15,901 points. We are suspecting the recent up moves on a low volume and low VIX. As a result of low VIX, the market started witnessing high impulsive actions during the last week. In fact, many sharp and impulsive corrective moves are limited to intraday. On Monday, the Nifty saw a sharp pullback of 205 points from the day's low. On Friday, also it retraced over 232 points. On Tuesday, after hitting the lifetime high, it has formed an evening star Doji candle. During the week, the range has gone up by 450 points. The weekly price action indicates a pause for bulls amid elevated volatility. As the Nifty already has three distribution day counts, an increase on declining days is a concern and a classical distribution sign. It almost tested the high on February 16. The frontline index has formed a lower low on Friday and breached the 20SMA intraday basis. This is the first sign that the price is retracing back to the mean level. Currently, it is just 0.51 per cent away from the 20DMA and 4.12 per cent away from 50DMA. Interestingly, the major profit booking is in mid and small-cap stocks as these indices declined by 3.1 per cent and 1.8 per cent. These broader indices were outperforming the benchmarks in the recent past. This is another weak point in the overall market structure. The last week's price action shows clear signs of exhaustion and indicating a corrective consolidation, as the Nifty formed a lower low. The dwindling market breadth is also another sign of distribution rotation.
The volatility remains at the lowest level. Even though it up by 4.92 per cent during the last, it is still below the 15 levels. It tested to test the February 2020 levels. The low volatility leads to impulsive moves; in most cases, it will be on the downside. We may see a further increase in intraday moves and daily ranges because of low VIX. It will be a difficult task to trade on an intraday basis. Next week's close will be critical to forecast the market direction for the near term. A negative close or a lower high will be an early sign of the market top. On the upside, the 15800-900 range will be a strong resistance zone. On the downside, 15400-15431 will act as support. A close below the support, the Nifty, with all probability, will test the 50DMA of 15063 soon.
The daily MACD has already given a sell signal by moving below the signal line. The CCI is below the prior swing low, which signifies that the minor top is in place. The RSI also below the prior minor low and broken the support. Negative directional indicator -DMI is almost at its February high indicates the weakness in the trend.
(The author is a financial journalist and technical analyst. He can be reached at [email protected])

© 2024 Hyderabad Media House Limited/The Hans India. All rights reserved. Powered by hocalwire.com


