Understanding Candlesticks

The Japanese have developed candlesticks in the 18th century The movement of the share price can be understood easily with the help of candlesticks These are more useful for traders Candlesticks are used to identify trading patterns Patterns in turn help the technical analyst to set up a trade
The Japanese have developed candlesticks in the 18th century. The movement of the share price can be understood easily with the help of candlesticks. These are more useful for traders. Candlesticks are used to identify trading patterns. Patterns in turn help the technical analyst to set up a trade.
Candle is in a rectangular shape, wherein rectangle is called the body of the candle. A green colour candle is called as a bullish candle and denotes upper trend of the share price. Contrary to this red candle is a bearish candle and suggests downtrend of the share price.
The down part of the green candle indicates open price and upper end indicates the closing price. In a bearish candle the upper part shows the open price and the lower part indicates the closing price. If the closing price is more than the opening price then the candle is bullish. A candle has two lines on its upper and lower body. These lines are generally referred to as shadow, wicks or tails.
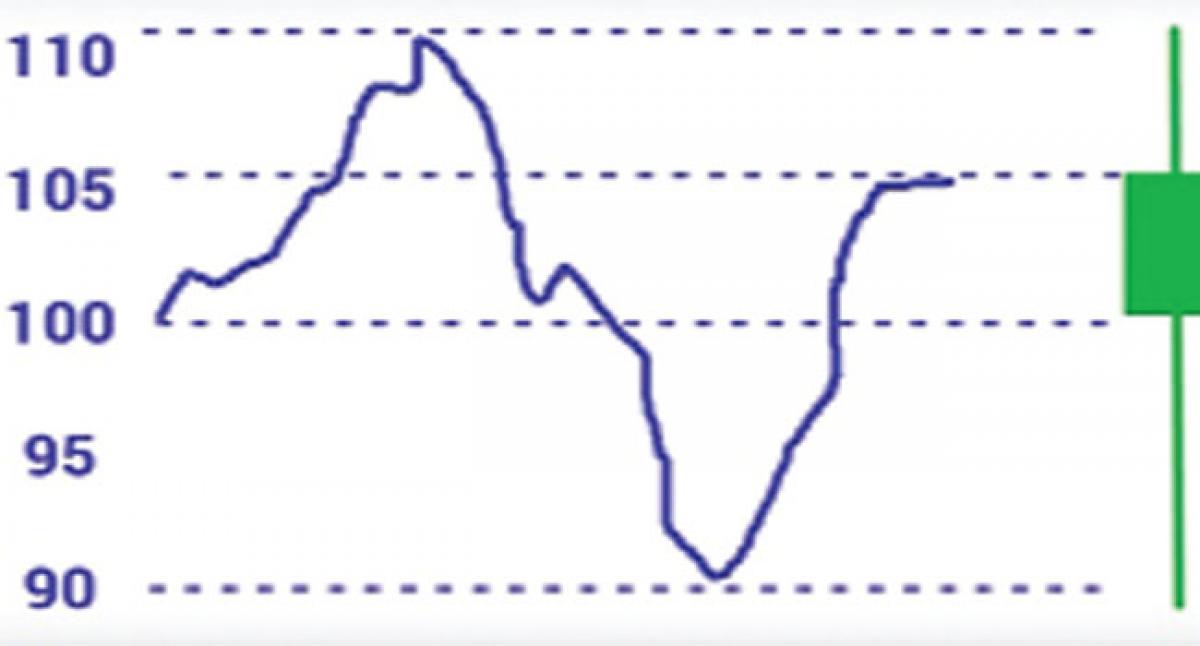
The line on the upper part of the body indicates the highest price of the stock at a particular time. Similarly, the line on the lower part of the candle indicates the lowest price. Let us analyse the movement of share price with the help of a chart. Suppose open price is 100 and closing price is 105. Its highest price is 110 and lowest price is 90.
Let us see this in a chart to see how a candle stick is formed Sometimes a doji candle is formed. Doji candle is usually in a plus shape. It has no body or it may have a minimum body. Doji candle is formed when the open price and closing price of a share is almost same.
This is the image of doji candlesGenerally, candlesticks are usually available in a minute chart, hour chart or day chart. Information on candlesticks is available on moneycontrol.com, investing.com etc. To conclude, bullish candle calls for a buy and bearish candle suggests selling.


