Live
- Aishwarya Rai Bachchan’s Sister-in-Law Shrima Rai Shares Cryptic Post After Taking a Dig at Her
- Karnataka: Congress ministers indulge in lobbying ahead of Cabinet reshuffle
- Tur, urad prices have fallen in last 3 months: Govt
- NASA Alert: 130-ft Asteroid 2024 WQ2 Racing Past Earth at Over 62,000 km/h – Should We Be Concerned?
- What is UNSC Resolution 1701 and How it Relates to the Israel-Lebanon Ceasefire
- CM Mohan Majhi reviews preparedness at BJP state office ahead of PM Modi's visit
- Lisandro Martinez available for selection against Bodo/Glimt confirms Amorim
- Shivakumar appeals Union Forest Minister to expedite environmental clearance for Kalasa-Banduri project
- V Jagadishwar Goud Inspects Development in Serilingampalli Constituency
- Hyderabad Water Board Cracks Down on Illegal Nalla Connections, Orders Criminal Cases
Just In

The 70th round of the NSSO Survey on Household Assets & Liabilities revealed a stark picture of inequality in India. The average value of the assets per household in rural areas was found to be 10.07 lakh while the corresponding value in urban areas was 22.85 lakh. The difference in the average asset holding of the top and bottom 10% was as high 50000 times in urban areas.
The 70th round of the NSSO Survey on Household Assets & Liabilities revealed a stark picture of inequality in India. The average value of the assets per household in rural areas was found to be 10.07 lakh while the corresponding value in urban areas was 22.85 lakh. The difference in the average asset holding of the top and bottom 10% was as high 50000 times in urban areas.
The latest NSSO 70th round report on Household Assets and Liabilities revealed the stark Inequality in India between those at the top and the bottom. The report has data on assets held by households in both rural and urban areas apart from information on their debt.
Significant changes in the procedure compared to the previous survey
The National Sample Survey Office (NSSO) made significant changes to the procedure of this survey compared to the previous round in 2003. The NSSO says that these changes were made to reflect the changed scenario in the country. Some of the procedural changes include the following.
- The value of land/buildings in the present round was recorded based on guideline values where as the values in the 2003 survey was based on the values reported by the informants.
- Household durables including Gold, Ornaments were not considered as assets in this round. The NSSO felt that the valuation of durable is difficult to obtain. In the previous round all household durables including gold and ornaments were part of asset value.
Majority value of the assets in this round was found to be from Land & buildings.
Average Value of Assets in Urban India is more than twice the value of Rural India
According to the report, the 93.5% of the households in Urban India hold assets while the corresponding percentage for Rural India is 98.3%. These percentages are significantly lesser than the corresponding percentages in the previous round, possibly because of the exclusion of Gold and other durable items.
In terms of average value of assets, the average value of assets per household was 10.07 lakh rupees in Rural India and 22.85 lakh rupees in Urban India.
Asset Holding: Haryana leads in the Rural Areas
In Rural India, the average value of assets per household is highest in Haryana at 46.17 Lakh rupees followed by Punjab (42.95 lakh). These are the only two states out of the eighteen surveyed with the average value of assets that is four times the national average. The other states in the top five are Kerala (27.3 lakh), Gujarat (18.43 lakh) and Maharashtra (11.23 lakh). Out of the eighteen states surveyed, the average value of assets was more than the national average in 7 states, while it was less than the national average in the remaining 11 states.
Asset Holding: Maharashtra leads in Urban Areas
In Urban India, the average value of assets per household is highest in Maharashtra at 43.37 Lakh rupees followed by Kerala (40.24 lakh). The other states in the top five are Haryana (36.78 lakh), Assam (28.48 lakh) and Punjab (26.38 lakh). Out of the eighteen states surveyed, the average value of assets was more than the national average in 6 states, while it was less than the national average in the remaining 12 states. The four states of Maharashtra, Kerala, Haryana & Punjab are in the top five in both Urban and Rural areas.
Huge Difference in the Top & Bottom 10%
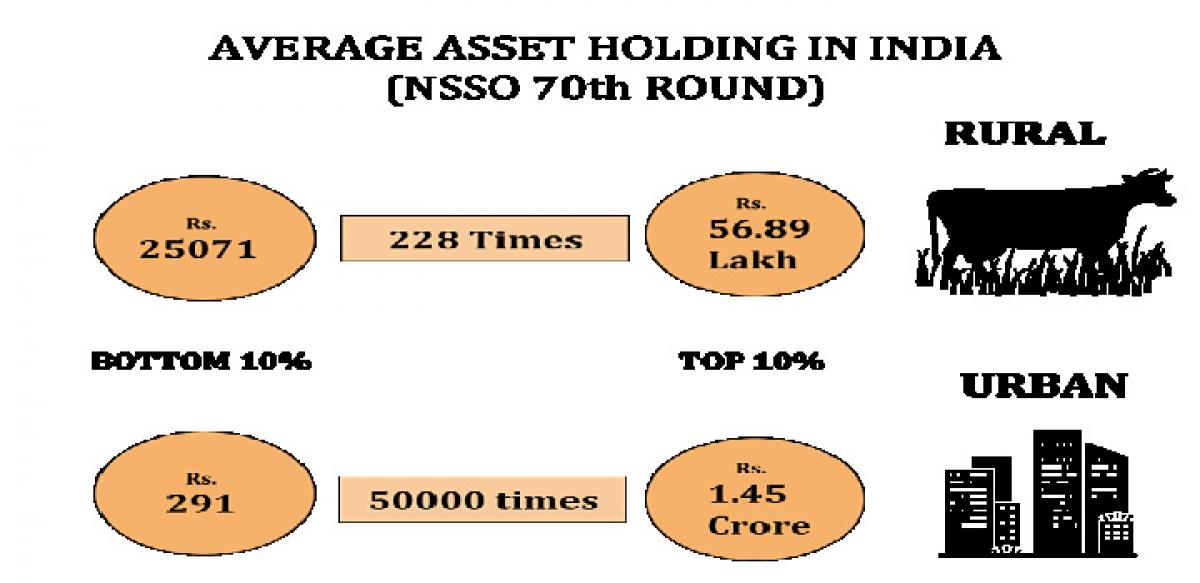
In Rural, the average value of assets of the bottom 10% is Rs 25071 while the corresponding value for the top 10% is Rs 56.89 lakh rupees. The average asset holding of the top 10% is almost 228 times the average asset holding of the bottom 10%.
In Urban, this difference is even starker. The average value of assets of the bottom 10% is just Rs 291 while the corresponding value for the top 10% is 1.45 crore rupees. The average asset holding of the top 10% is almost 50000 times the bottom 10%. This could be because of the large number of poor people who migrate to the urban areas with no asset after migration.

© 2024 Hyderabad Media House Limited/The Hans India. All rights reserved. Powered by hocalwire.com


