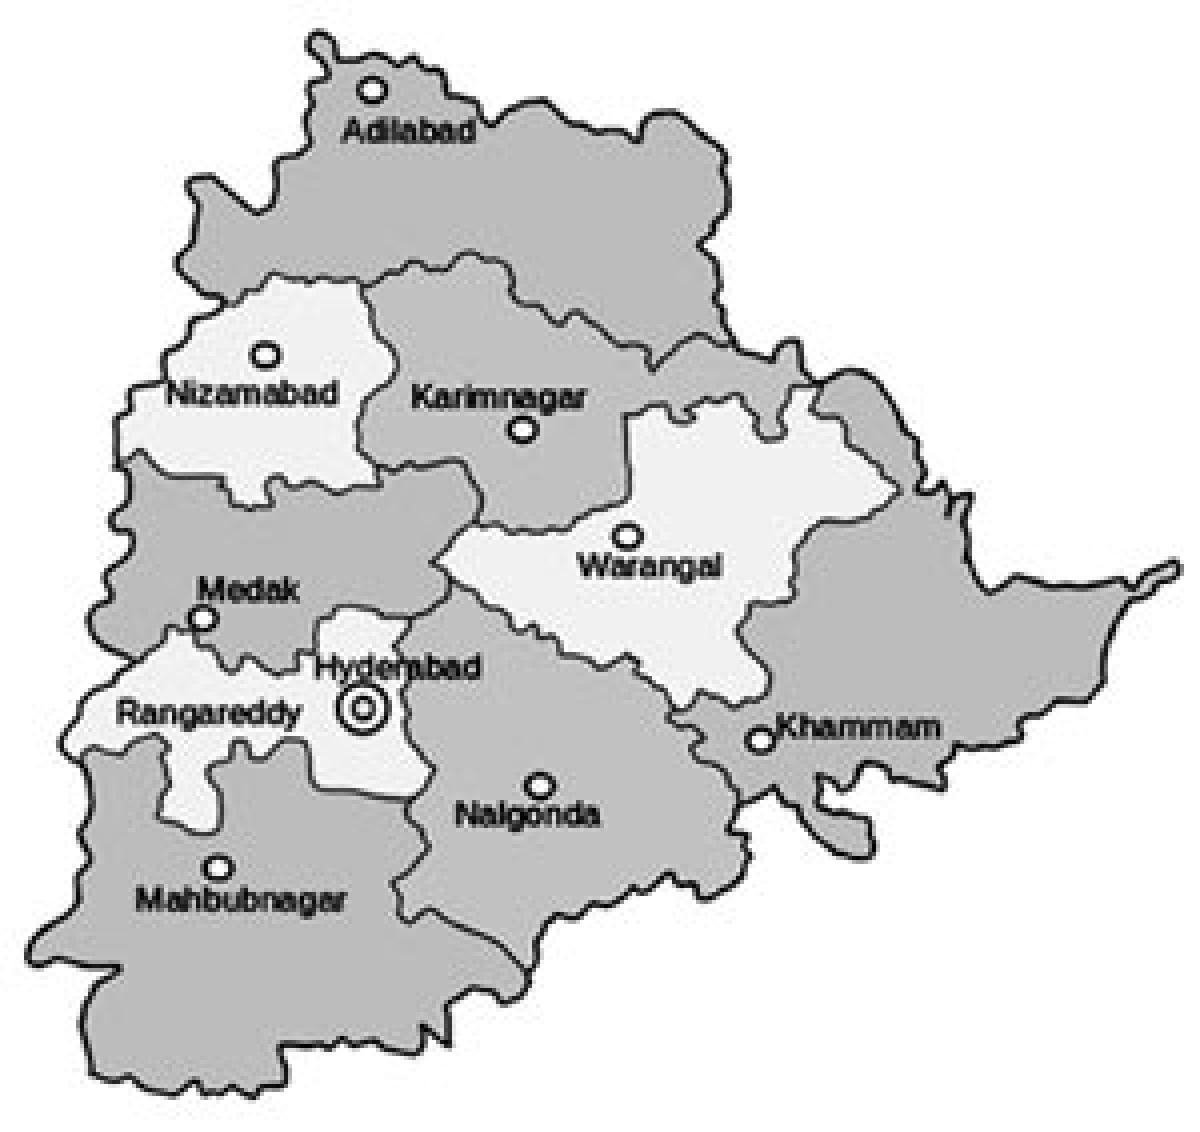
Glaring inequalities among Telangana State districts

The in table-I figures indicate glaring inter-district disparities presenting a dismal picture of some of the districts like Adilabad, Nizamabad, Mahbubnagar, Karimnagar and Warangal, while it is bright for other districts like Hyderabad, Rangareddy, , Medak, Nalgonda and Khammam.
It is revealing to examine the district-wise per capita income at current prices for the 10 districts of Telangana for the last 4 years as in table-I.
The in table-I figures indicate glaring inter-district disparities presenting a dismal picture of some of the districts like Adilabad, Nizamabad, Mahbubnagar, Karimnagar and Warangal, while it is bright for other districts like Hyderabad, Rangareddy, , Medak, Nalgonda and Khammam.
In this context, the lowest and the highest income districts are grouped under ‘A’ and ‘B’ category as shown below:
In the above context, it is necessary to examine the per capita income of Telangana State which is shown at Rs 1,29,182 in 2014-15 in Table-I.
A cursory look will show that except Hyderabad and Ranga Reddy districts, all other districts show much below the State per capita income, which is a notable feature. This is another anomaly which requires consideration by the government.
The reason for this glaring disparity appears to be high per capita income of Hyderabad and Ranga Reddy districts which contributed to the higher State per capita income despite their much higher population. In such a situation, there is a need for preventing further concentration of industries and economic and governmental activities in Hyderabad and Ranga Reddy districts except service sector.
The continued population and density of Hyderabad and Ranga Reddy districts as per the 2011 Census are shown in Table-II.
The figures clearly indicate that more wealth is concentrated in these two districts. In the above context, there is another important feature to be considered. That is the large remittances sent by persons working in Gulf countries and also in US and other countries in the case of Adilabad, Nizamabad, Karimnagar, Mahbubnagar and Warangal.
Hence there is a need for clarification whether these remittances were included in the per capita income of the people in the above districts. In this connection it may be stated that the present disparity will appear more sharp and discriminating after the formation of 14 new districts during this year.
It is thus clear that if the intra-district disparities are not checked effectively, the gap will become much more wide between the two groups of districts, resulting in adverse effect on the incomes and wellbeing of the people in ‘A’ group districts, particularly weaker sections, resulting in migration from these areas to big cities.
Remedial measures
There is an urgent need for taking remedial measures for raising income levels in Group-A districts to bring them on par with the higher income ‘B’ group districts as well as the State per capita income. For this purpose, special plans require to be formulated for these districts by promoting and locating more industries in these districts while stopping new industries in Hyderabad and RR districts.
The concentration of industries and institutions in and around Hyderabad will only further widen the gap beyond repair in future. It is hoped that this vital issue will receive urgent attention of the government for taking remedial measures when it is proposing to create more districts 24 out of the ten above. (The writer is a former Member of Parliament from Nizamabad)
Table-I
S.no District 2011-12 2012-13 2013-14 2014-15
1 Adilabad 55155 59892 65031 76921
2 Nizamabad 57092 59820 72036 78828
3 Karimnagar 65932 73051 84313 90184
4 Medak 103498 110286 116129 121639
5 Hyderabad 198899 225952 259371 294220
6 Rangareddy 131240 143422 158452 180039
7 Mahbubnagar 54699 64377 69562 80121
8 Nalgonda 76487 85498 100514 114353
9 Warangal 56215 61608 71422 81221
10 Khammam 71127 77505 89020 102919
State per capita income 91664 101602 114669 129182
Category – A
District-wise Lowest Income during 2014-15
S.no District Per capita income
1 Adilabad 76921
2 Nizamabad 78828
3 Mahbubnagar 80121
4 Warangal 81221
5 Karimnagar 90184
Category-B
District-wise Highest income during 2014-15
S.no District Per capita income
1 Hyderabad 294220
2 Rangareddy 180039
3 Medak 121639
4 Nalgonda 114353
5 Khammam 102919
Table-II
S.no District Population Density (sq. km)
1 Hyderabad 4010238 18480
2 Ranga Reddy 5296396 707
By M Narayan Reddy


