Live
- Basavanagudi Kadalekai Parishe: Govt gives good news to groundnut traders
- Yanamala blames YSRCP policies for collapse of state economy
- Call to inculcate habit of reading books
- 63% parents give milk to their kids to maintain intake of calcium
- Maoist Leader Manjula Surrenders in Warangal, Receives ₹20 Lakh Reward
- Kartika Purnima celebrations fervour marks Telugu States, devotees flock to shiva shrines
- YSRCP alleges meagre fund allocations for Super Six schemes
- Telangana CM Reviews Plans for First Anniversary of State Government
- Vijayawada: Kindness Day celebrated
- Rajamahendravaram: Students advised to set clear goals
Just In
India tops global indoor air pollution chart with highest annual PM2.5 levels: Global Dyson Study


Dyson’s first Global Air Quality Connected Data project examines the indoor air quality data from more than 2.5m connected Dyson air purifiers.
Today, Dyson unveils the results of its first Global Connected Air Quality Data project. The project analyses indoor air quality information collected by more than 2.5 million Dyson Purifiers from 2022 to 2023 to landscape air quality in real homes across the world, to a high degree of granularity, breaking down pollution into gas and particle pollutants, and profiling trends over days, months, seasons and the full year. The data comes from Dyson Purifiers connected to the MyDyson app; the volume of data exceeds half a trillion data points and paints a precise picture of indoor air quality in cities and countries globally to help build understanding and awareness of indoor air pollution.
What is PM2.5? What are VOCs?
From a wealth of data, this project focuses on two types of pollutants – PM2.5, and Volatile Organic Compounds (VOCs). PM2.5 refers to particles as small as 2.5 microns in diameter, 1/25th the diameter of a typical human hair. These particles are invisible to the naked eye, can be inhaled and are an area of increasing scientific and health research. Sources include combustion, – wood burners, or gas cooking and heating – pet dander, ash and dust. VOCs are gas pollutants including Benzene and Formaldehyde which can be emitted from activities like cleaning or gas cooking as well as from products including deodorants and body sprays, candles, furniture and furnishings.
“Our connected air quality data allows us insight into the real problem of indoor air pollution in homes across the world. This gives us a direct understanding of the challenges Dyson Purifiers face in real environments and the knowledge to engineer ever-better machines to tackle those challenges. But the data we capture isn’t just an engineering tool – on an individual basis, this data is shared back through the MyDyson app in real-time and via monthly reports, to help our Owners improve their air quality understanding.” – Matt Jennings, Engineering Director for Environmental Care
We all think of air pollution as being an outdoor or roadside problem. Indoor air pollution research is growing, but continues to be underdeveloped. Dyson's findings give us a valuable insight into the real pollution levels in homes across the world, helping us to understand the patterns of pollution daily, monthly and seasonally. The Dyson data is an incredibly powerful education tool and the opportunities for positive impact are boundless – understanding the pollution around us is the first step to reducing our pollution exposure.” – Professor Hugh Montgomery, Chair of Intensive Care Medicine at University College London, and Chairperson of Dyson’s Scientific Advisory Board
Where does India stand when it comes to Indoor Air Quality?
According to the report, India recorded the highest average annual PM2.5 levels, followed by China, Turkey, UAE, and South Korea, while in terms of indoor average VOCs, India ranked 7th among the top 10. Moreover, Delhi topped the list of PM2.5 levels, amongst the studied cities, with the highest indoor annual average PM2.5 levels of 69.29, followed by Beijing, Shanghai, Shenzhen and Busan.
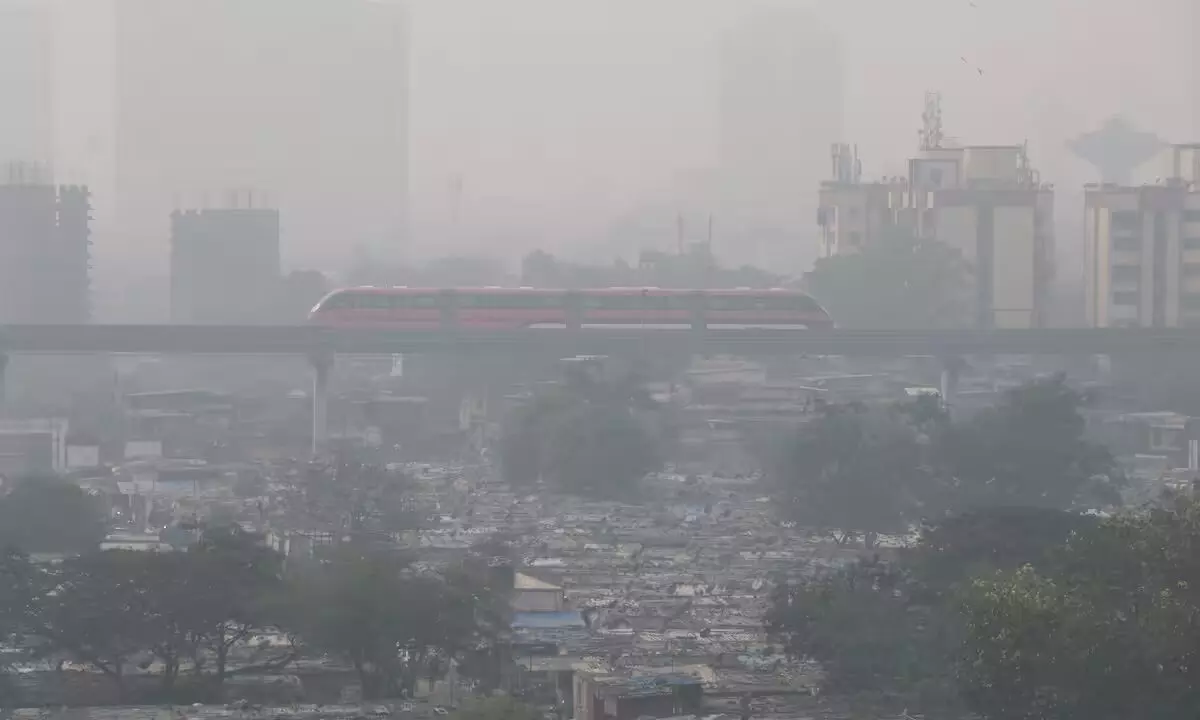
India's battle with pollution isn't limited to outdoors. The study reveals that air inside our homes can be significantly worse, particularly during the winter season, with PM2.5 levels exceeding health standards set by WHO. Winter was, in general, the most polluted season across the markets – even in the southern hemisphere – where colder weather traps polluted air nearer to ground level. Pollution peaks in the winter season, especially in Delhi, with November and December being the most polluted months. Shockingly, the air inside homes during winter was found to be a staggering 15% worse than outside, effectively trapping smoke within our walls. In fact, across India, the indoor air gets 41% dirtier during these months, and in Delhi, it's even worse at 48%. Unlike most places where the air is worst at night, in India, the most polluted time inside was between 7 am and midday. That means we're breathing in the polluted air right when we wake up.
The need to invest in an Air purifier
Investing in an air purifier is one of the most effective ways to remove a wide range of pollutants from the air. Dyson air purifier range offers full-machine HEPA filtration- ensuring that what goes inside, stays inside. Its latest air purification technology - The Dyson Purifier Big+Quiet, is designed to purify the air in spaces as large as 1076 sq. ft. It uses Cone Aerodynamics to deliver a 10-meter projection. Alongside powerful projection, the Dyson Purifier Big+Quiet is also engineered to operate quietly, producing just 56 decibels of noise - making it Dyson’s quietest yet most powerful purifier. Dyson’s other air purifiers such as the Dyson Purifier Cool™ Formaldehyde use Air Multiplier™ technology to project and circulate purifier air in the entire room to maintain air quality within your home all year round.
Graphs
Global PM2.5 trend over 24hr period
Global annual pollution trend, shown seasonally

© 2024 Hyderabad Media House Limited/The Hans India. All rights reserved. Powered by hocalwire.com


